Legend: Upper graph of each pair is motor speed V (proportional to edot); lower graph is load (in volts). Translate motor V to edot thus: V1.00 ≈ 6e-6/s ≈ 2%/hr. Load to stress translation for ice767 is roughly ____ MPa/mV, with a __ mV zero offset. Horizontal scale is time. 5000 ≈ 14 hrs.
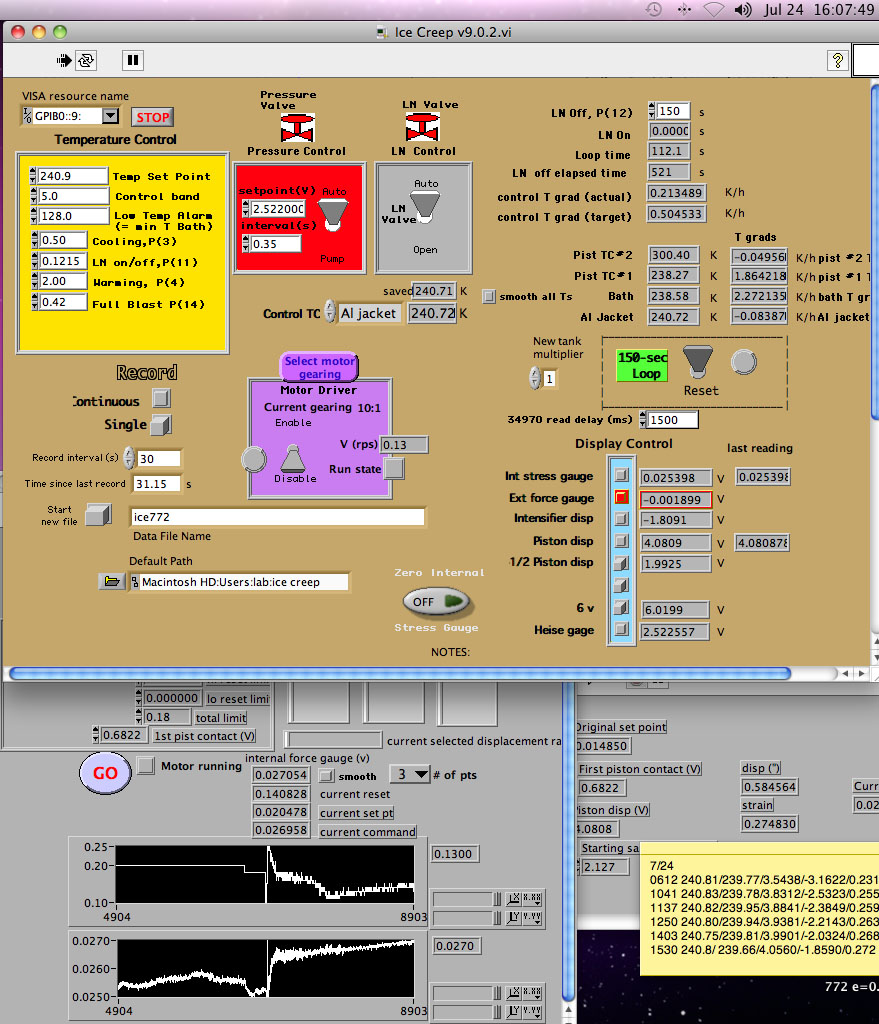
To end of run. Action in the middle is the result of a force gage zero check that revealed s had drifted high, and was actually above the 3 MPa target. Correcting to 3 MPa results in falling below the 15%/day limit, so mode returns to creep for the last ~6 hours of the run. (Don't worry about appearances. This will all look much much better when Meike does the data reduction and straightens everything up.)
7/23/14 1607 hrs
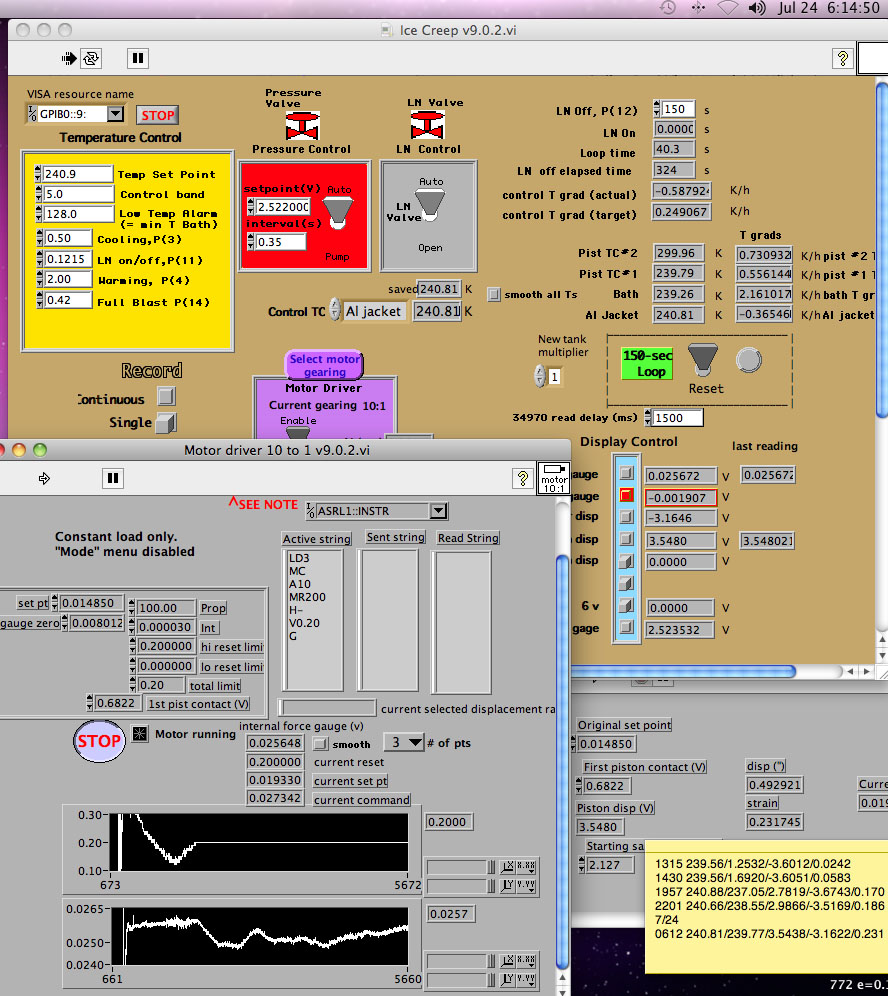
In creep mode at 3 MPa, sample apparently hardens and then softens (i.e. udot on the top chart falls, then rises), and after ~4 hrs hits our preplanned strain rate cap of roughly 15%/day, or udot ~V0.20. Turns out the up/down thing at the beginning was probably an artifact of a (as yet unexplained) 2 K temperature swing.
7/24/14 0614 hrs
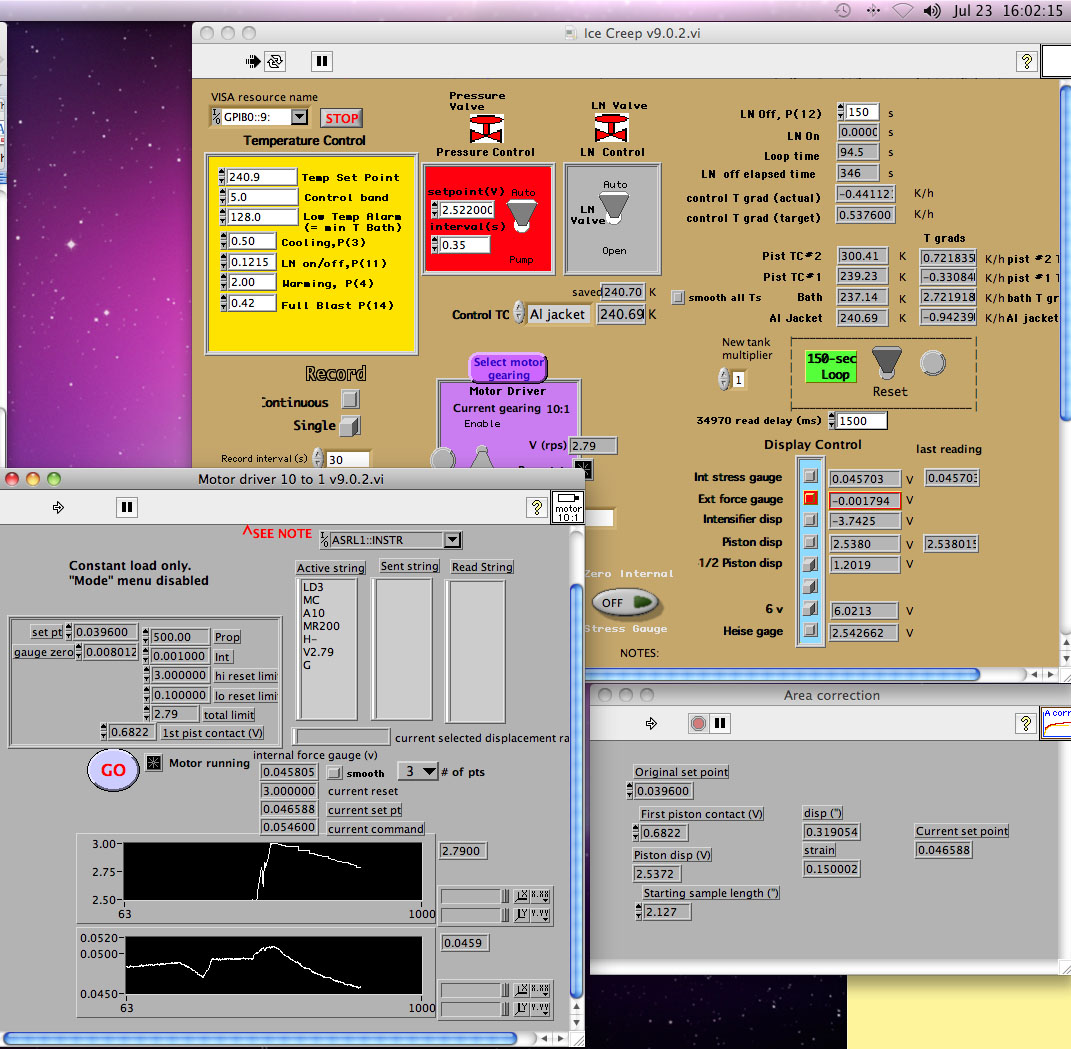
12 minutes later, at the moment of drop to 3 MPa and return to creep mode.
7/23/14 1602 hrs
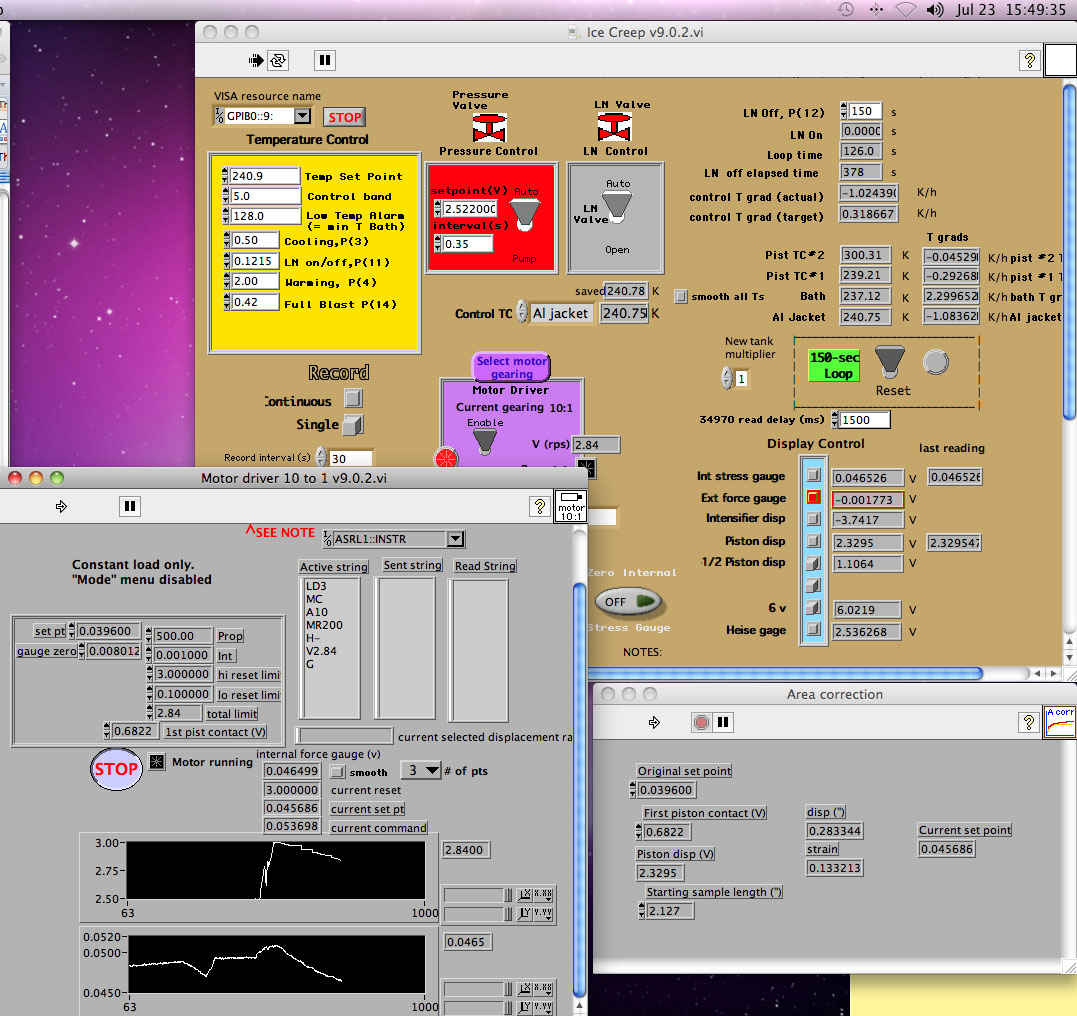
Wild ride, most of it clipped off the bottom below V2.50 on upper chart, sorry. One will have to wait for data reduction to see it. 8 MPa constant stress condition to e=0.08 as sample softened radically by almost 1 order of magnitude in edot, then constant edot (roughly 8e-5/s) invoked at V3.00. Decreasing udot beyond V3.00 invoked manually to maintain constant edot condition.
7/23/14 1550 hrs